Case fatality rate of SARS-CoV-2 Compared with other diseases
The case fatality rate (CFR) is simply the number of confirmed deaths divided by the number of confirmed cases.
When the number of actual cases and deaths is not known – as is the case for COVID – one has to be careful in interpreting
the CFR. In the sections that follow we explain what we can and cannot learn about the mortality risk based on the CFR.
The Case Fatality Rate (CFR) of SARS-CoV-2 is estimated to be between 1 & 2%. Many find it unsettling that the mortality risk
is still an inaccurate estimate; however, there is good reason for this uncertainty, as detailed below.

Case fatality rate (CFR)
In the media, it is often the “case fatality rate” that is talked about when the risk of death from COVID-19 is discussed.1
This measure is sometimes also called case fatality risk or case fatality ratio. It is often abbreviated as CFR.
The CFR is not the same as the risk of death for an infected person – even though, unfortunately, journalists sometimes
suggest that it is. It is relevant and important, but far from the whole story.
The CFR is easy to calculate. You take the number of people who have died from the disease, and you divide it by the total
number of people diagnosed with the disease. So if 10 people have died, and 100 people have been diagnosed with the
disease, the CFR is [10 / 100], or 10%.
But it’s important to note that it is the ratio between the number of confirmed deaths from the disease and the number of
confirmed cases, not total cases. That means that it is not the same as – and, in fast-moving situations like COVID-19,
probably not even very close to – the true risk for an infected person.
Another important metric, which should not be confused with the CFR, is the crude mortality rate.
Crude mortality rate
The “crude mortality rate” is another very simple measure which, like the CFR, gives something that might sound like the
answer to the question “if someone is infected, how likely are they to die?”.
But, just as with CFR, it is actually very different.
The crude mortality rate – sometimes also called the crude death rate – measures the share among the entire population that
have died from a particular disease. It’s calculated by dividing the number of deaths from the disease by the total population.
For instance, if there were 10 deaths in a population of 1,000, the crude mortality rate would be [10 / 1,000], or 1%.
Unfortunately, writers sometimes confuse case fatality rates and crude death rates. A common example is the Spanish flu
pandemic in 1918. One estimate for the death toll of the Spanish flu, by Johnson and Mueller (2002), is that the pandemic
killed 50 million people.2 That would have been 2.7% of the world population at the time. This means the crude mortality rate
was 2.7%.
But 2.7% is often misreported as the case fatality rate – which is wrong, because not everyone in the world was infected with
the virus that caused the Spanish flu. If the crude mortality rate really was 2.7%, then the case fatality rate was much higher – it
would be the percentage of people who died after being diagnosed with the disease. [We looked at the global death count of
the Spanish flu pandemic and others here.]
Infection fatality rate (IFR)
The key question for understanding the mortality risk of a disease is the following: if someone is infected with the disease how
likely is it that they will die from it? The answer to that question is captured by the infection fatality rate, or IFR.
The IFR is the number of deaths from a disease divided by the total number of cases. If 10 people die of the disease, and 500
actually have it, then the IFR is [10 / 500], or 2%.
To work out the IFR, we need two numbers: the total number of cases and the total number of deaths from the disease.
However, as we explain here, the total number of cases of COVID-19 is not known. One big reason for this is that not
everyone with COVID-19 is tested.
The total number of cases is not known, so the IFR cannot be simply calculated from observed data. But, researchers are able
to estimate the total number of cases and use that to calculate the IFR – we get to this further below.
Why the Case Fatality Rate does not reflect the risk of dying from COVID-19
There is a straightforward question that most people would like answered. If someone is infected with COVID-19, how likely is
that person to die?
This question is simple, but surprisingly hard to answer.
The key point is that the case fatality rate (CFR) – the most commonly discussed measure – is not the answer to the question.
The main reason why it does not answer that question is that the CFR relies on the number of confirmed cases, and many
cases are not confirmed.
In order to understand what the case fatality rate can and cannot tell us about a disease outbreak such as COVID-19, it’s
important to understand why it is difficult to measure and interpret the numbers.
The case fatality rate isn’t constant: it changes with the context
Sometimes commentators talk about the CFR as if it’s a single, steady number: an unchanging fact about the disease.
But it’s not a biological constant; instead, it reflects the situation in a particular context, at a particular time, in a particular
population.
The probability that someone dies from a disease doesn’t just depend on the disease itself, but also on the treatment they
receive, and on the patient’s own ability to recover from it.
This means that the CFR can decrease or increase over time, as responses change; and it can vary by location and by the
characteristics of the infected population, such as age, or sex. For instance, older populations would expect to see a higher
CFR from COVID-19 than younger ones.
The CFR of COVID-19 differs by location, and has changed during the early period of the
outbreak
The case fatality rate of COVID-19 is not constant. This was clear right from the start of the pandemic. You can see that in the
chart below, first published in the Report of the WHO-China Joint Mission on Coronavirus Disease 2019 (COVID-19), in
February 2020.
It shows the CFR for COVID-19 in several locations in China during the early stages of the outbreak, from the beginning of
January to 20th February 2020.
You can see that in the earliest stages of the outbreak the CFR was much higher: 17.3% across China as a whole (in yellow)
and greater than 20% in the center of the outbreak, in Wuhan (in blue).
But in the weeks that followed, the CFR declined, reaching as low as 0.7% for patients who first showed symptoms after
February 1st. The WHO reported that that was because “the standard of care has evolved over the course of the outbreak”.
You can also see that the CFR was different in different places. By 1st February, the CFR in Wuhan was still 5.8% while it was
0.7% across the rest of China.
This shows that what we said about the CFR generally – that it changes from time to time and place to place – is true for the
CFR of COVID-19 specifically. When we talk about the CFR of a disease, we need to talk about it in a specific time and place
– the CFR in Wuhan on 23rd February, or in Italy on 4th March – rather than as a single unchanging value.
There are two reasons why the case fatality rate does not reflect the risk of death
If the case fatality rate does not tell us the risk of death for someone infected with the disease, what does it tell us? And how
does the CFR compare with the actual mortality risk?
There are two reasons why we would expect the CFR not to represent the real risk. One of them would tend to make the CFR
an overestimate – the other would tend to make it an underestimate.
When there are people who have the disease but are not diagnosed, the CFR will overestimate the true risk of death. With
COVID-19, we think there are many undiagnosed people.
As we saw above, in our discussion on the difference between total and confirmed cases (here), we do not know the number
of total cases. Not everyone is tested for COVID-19, so the total number of cases is higher than the number of confirmed
cases.
Whenever there are cases of the disease that are not counted, the probability of dying from the disease is lower than the
reported case fatality rate. Remember our imaginary scenario with 10 deaths and 100 cases. The CFR in that example is 10%
– but if there actually 500 cases (and we’ve simply missed 400 of them due to lack of testing), then the real risk (the IFR) is just
2%.
Or to summarize in one sentence. If the number of total cases is higher than the number of confirmed cases, then the ratio
between deaths and total cases is smaller than the ratio between deaths and confirmed cases.12
Importantly, this means that the number of tests carried out affects the CFR – you can only confirm a case by testing a patient.
So when we compare the CFR between different countries, the differences do not only reflect rates of mortality, but also
differences in the scale of testing efforts.
A second consideration is especially important in the early stages of an outbreak: When some people are currently
sick and will die of the disease, but have not died yet, the CFR will underestimate the true risk of death.
In ongoing outbreaks, people who are currently sick will eventually die from the disease. This means that they are currently
counted as a case, but will only eventually be counted as a death too. With the COVID-19 outbreak, it can take several weeks
for people to go from first symptoms to death.
This means that the CFR in the early stages is an underestimate of what it will be when the outbreak has run its course.
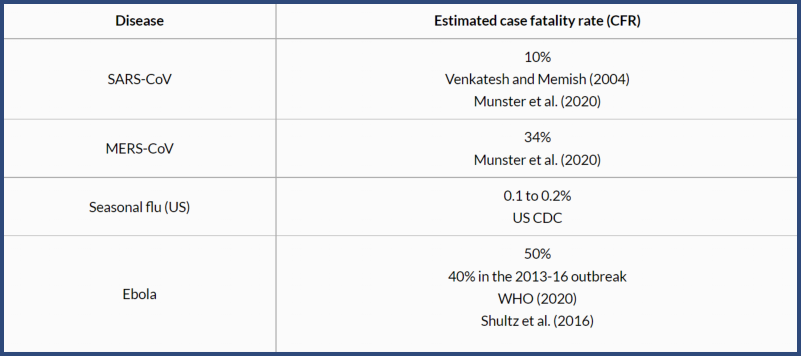
Case fatality rate of other diseases
Once again, we should stress what we discussed above. One has to understand the measurement challenges and the
definitions to interpret estimates of the CFR for COVID-19, particularly those relating to an ongoing outbreak.
As comparisons, the table shows the case fatality rates for other disease outbreaks. The CFR of SARS-CoV and MERS-CoV
were high: 10% and 34%, respectively.
The US seasonal flu has a case fatality rate of approximately 0.1% to 0.2%.
Acknowledgements
We would like to acknowledge and thank a number of people in the development of this work: Carl Bergstrom, Bernadeta
Dadonaite, Natalie Dean, Joel Hellewell, Jason Hendry, Adam Kucharski, Moritz Kraemer and Eric Topol for their very helpful
and detailed comments and suggestions on earlier versions of this work. Tom Chivers we would like to thank for his editorial
review and feedback.
And we would like to thank the many hundreds of readers who give us feedback on this work every day. Your feedback is what
allows us to continuously clarify and improve it. We very much appreciate you taking the time to write. We cannot respond to
every message we receive, but we do read all feedback and aim to take the many helpful ideas into account. Thank you all.
Citation
Our articles and data visualizations rely on work from many different people and organizations. When citing this entry, please
also cite the underlying data sources. This entry can be cited as:
Hannah Ritchie, Edouard Mathieu, Lucas Rodés-Guirao, Cameron Appel, Charlie Giattino, Esteban Ortiz-Ospina, Joe Hasell,
Bobbie Macdonald, Diana Beltekian and Max Roser (2020) - "Coronavirus Pandemic (COVID-19)". Published online at
OurWorldInData.org. Retrieved from: 'https://ourworldindata.org/coronavirus' [Online Resource]
BibTeX citation
@article{owidcoronavirus,
author = {Hannah Ritchie, Edouard Mathieu, Lucas Rodés-Guirao, Cameron Appel, Charlie Giattino, Esteban Ortiz-Ospina,
Joe Hasell, Bobbie Macdonald, Diana Beltekian and Max Roser},
title = {Coronavirus Pandemic (COVID-19)},
journal = {Our World in Data},
year = {2020},
note = {https://ourworldindata.org/coronavirus
Endnotes
For examples see Worldometers. Worldometers lists many poor examples of ‘mortality rates’ for COVID-19 without discussion here.
Taubenberger, J. K., & Morens, D. M. (2006). 1918 Influenza: the mother of all pandemics. Revista Biomedica, 17(1), 69-79.
We would therefore calculate the infection fatality rate as:
Infection fatality risk (IFR, in %) = [Number of deaths from disease / total number of cases of disease] x 100
Wong, J. Y., Heath Kelly, D. K., Wu, J. T., Leung, G. M., & Cowling, B. J. (2013). Case fatality risk of influenza A (H1N1pdm09): a systematic review. Epidemiology,
24(6).
Lipsitch, M., Donnelly, C. A., Fraser, C., Blake, I. M., Cori, A., Dorigatti, I., … & Van Kerkhove, M. D. (2015). Potential biases in estimating absolute and relative
case-fatality risks during outbreaks. PLoS Neglected Tropical Diseases, 9(7).
Kobayashi, T., Jung, S. M., Linton, N. M., Kinoshita, R., Hayashi, K., Miyama, T., … & Suzuki, A. (2020). Communicating the Risk of Death from Novel Coronavirus
Disease (COVID-19). Journal of Clinical Medicine.
Nishiura, H. (2010). Case fatality ratio of pandemic influenza. The Lancet Infectious Diseases, 10(7), 443.
Read JM, Bridgen JR, Cummings DA, Ho A, Jewell CP. Novel coronavirus 2019-nCoV: early estimation of epidemiological parameters and epidemic predictions.
medRxiv. 2020;2020.01.23.20018549.
World Health Organization (2020). Report of the WHO-China Joint Mission on Coronavirus Disease 2019 (COVID-19). Available online at:
https://www.who.int/docs/default-source/coronaviruse/who-china-joint-mission-on-covid-19-final-report.pdf
World Health Organization (2020). Report of the WHO-China Joint Mission on Coronavirus Disease 2019 (COVID-19). Available online at:
https://www.who.int/docs/default-source/coronaviruse/who-china-joint-mission-on-covid-19-final-report.pdf.
World Health Organization (2020). Report of the WHO-China Joint Mission on Coronavirus Disease 2019 (COVID-19). Available online at:
https://www.who.int/docs/default-source/coronaviruse/who-china-joint-mission-on-covid-19-final-report.pdf.
The relationship between CFR and IFR also depends on how large of a discrepancy there is between the number of confirmed and actual deaths, but we’d expect
the magnitude of undercounting of deaths to be less than for cases.
Munster, V. J., Koopmans, M., van Doremalen, N., van Riel, D., & de Wit, E. (2020). A novel coronavirus emerging in China—key questions for impact
assessment. New England Journal of Medicine, 382(8), 692-694.
The US flu data is sourced from the US CDC. Here we present an upper and lower estimate for the 2018-19 flu season. These two figures reflect whether we look
at the percentage of deaths out of the number of symptomatic illnesses (giving us 0.1%), or the number of medical visits (giving us 0.2%). In the traditional
calculation of CFR, we would tend to focus on the number of symptomatic illnesses. This is analogous to the number of confirmed cases, on which the COVID-19
figures are based. However, the US CDC derives these figures based on disease outbreak modelling which attempts to account for underreporting – you can read
more about how it derives its annual flu figures here.
This means that some of the biases which tend to underestimate the actual number of cases have been corrected for. This is not the case for the COVID-19
figures, so it may be an unfair comparison.
Looking at estimates based on the number of medical visits may discount from the US seasonal flu data many of the kind of mild cases that may have been
missed in the COVID-19 confirmed cases. However, this is likely to skew the comparison slightly in the other direction: we know that not all of the confirmed cases
included in COVID-19 figures were of a severity such that they would have received a medical visit in the absence of the heightened surveillance of the outbreak.
So, here we present both figures of the US seasonal flu figures: the CFR based on symptomatic illnesses, and those based on medical visits. It’s likely that the
fairest comparison to COVID-19 lies somewhere between these two values.
You can find the data for the reported cases, medical visits and deaths from the US Centers for Disease Control and Prevention (CDC) here. The CDC reports
35,520,883 symptomatic cases of influenza in the US and 34,157 deaths from the flu. To calculate the CFR based on symptomatic illnesses, we divide the number
of deaths by the number of confirmed cases and find a case fatality rate of 0.1%.{ref}(0.1%=[34,157 / 35,520,883] * 100)

Case fatality rate of SARS-CoV-2 Compared with other diseases
The case fatality rate (CFR) is simply the number of confirmed deaths divided by the number of confirmed cases.
When the number of actual cases and deaths is not known – as is the case for COVID – one has to be careful in interpreting
the CFR. In the sections that follow we explain what we can and cannot learn about the mortality risk based on the CFR.
The Case Fatality Rate (CFR) of SARS-CoV-2 is estimated to be between 1 & 2%. Many find it unsettling that the mortality risk
is still an inaccurate estimate; however, there is good reason for this uncertainty, as detailed below.
Case fatality rate (CFR)
In the media, it is often the “case fatality rate” that is talked about when the risk of death from COVID-19 is discussed.1
This measure is sometimes also called case fatality risk or case fatality ratio. It is often abbreviated as CFR.
The CFR is not the same as the risk of death for an infected person – even though, unfortunately, journalists sometimes
suggest that it is. It is relevant and important, but far from the whole story.
The CFR is easy to calculate. You take the number of people who have died from the disease, and you divide it by the total
number of people diagnosed with the disease. So if 10 people have died, and 100 people have been diagnosed with the
disease, the CFR is [10 / 100], or 10%.
But it’s important to note that it is the ratio between the number of confirmed deaths from the disease and the number of
confirmed cases, not total cases. That means that it is not the same as – and, in fast-moving situations like COVID-19,
probably not even very close to – the true risk for an infected person.
Another important metric, which should not be confused with the CFR, is the crude mortality rate.
Crude mortality rate
The “crude mortality rate” is another very simple measure which, like the CFR, gives something that might sound like the
answer to the question “if someone is infected, how likely are they to die?”.
But, just as with CFR, it is actually very different.
The crude mortality rate – sometimes also called the crude death rate – measures the share among the entire population that
have died from a particular disease. It’s calculated by dividing the number of deaths from the disease by the total population.
For instance, if there were 10 deaths in a population of 1,000, the crude mortality rate would be [10 / 1,000], or 1%.
Unfortunately, writers sometimes confuse case fatality rates and crude death rates. A common example is the Spanish flu
pandemic in 1918. One estimate for the death toll of the Spanish flu, by Johnson and Mueller (2002), is that the pandemic
killed 50 million people.2 That would have been 2.7% of the world population at the time. This means the crude mortality rate
was 2.7%.
But 2.7% is often misreported as the case fatality rate – which is wrong, because not everyone in the world was infected with
the virus that caused the Spanish flu. If the crude mortality rate really was 2.7%, then the case fatality rate was much higher – it
would be the percentage of people who died after being diagnosed with the disease. [We looked at the global death count of
the Spanish flu pandemic and others here.]
Infection fatality rate (IFR)
The key question for understanding the mortality risk of a disease is the following: if someone is infected with the disease how
likely is it that they will die from it? The answer to that question is captured by the infection fatality rate, or IFR.
The IFR is the number of deaths from a disease divided by the total number of cases. If 10 people die of the disease, and 500
actually have it, then the IFR is [10 / 500], or 2%.
To work out the IFR, we need two numbers: the total number of cases and the total number of deaths from the disease.
However, as we explain here, the total number of cases of COVID-19 is not known. One big reason for this is that not
everyone with COVID-19 is tested.
The total number of cases is not known, so the IFR cannot be simply calculated from observed data. But, researchers are able
to estimate the total number of cases and use that to calculate the IFR – we get to this further below.
Why the Case Fatality Rate does not reflect the risk of dying from COVID-19
There is a straightforward question that most people would like answered. If someone is infected with COVID-19, how likely is
that person to die?
This question is simple, but surprisingly hard to answer.
The key point is that the case fatality rate (CFR) – the most commonly discussed measure – is not the answer to the question.
The main reason why it does not answer that question is that the CFR relies on the number of confirmed cases, and many
cases are not confirmed.
In order to understand what the case fatality rate can and cannot tell us about a disease outbreak such as COVID-19, it’s
important to understand why it is difficult to measure and interpret the numbers.
The case fatality rate isn’t constant: it changes with the context
Sometimes commentators talk about the CFR as if it’s a single, steady number: an unchanging fact about the disease.
But it’s not a biological constant; instead, it reflects the situation in a particular context, at a particular time, in a particular
population.
The probability that someone dies from a disease doesn’t just depend on the disease itself, but also on the treatment they
receive, and on the patient’s own ability to recover from it.
This means that the CFR can decrease or increase over time, as responses change; and it can vary by location and by the
characteristics of the infected population, such as age, or sex. For instance, older populations would expect to see a higher
CFR from COVID-19 than younger ones.
The CFR of COVID-19 differs by location, and has changed during the early period of the
outbreak
The case fatality rate of COVID-19 is not constant. This was clear right from the start of the pandemic. You can see that in the
chart below, first published in the Report of the WHO-China Joint Mission on Coronavirus Disease 2019 (COVID-19), in
February 2020.
It shows the CFR for COVID-19 in several locations in China during the early stages of the outbreak, from the beginning of
January to 20th February 2020.
You can see that in the earliest stages of the outbreak the CFR was much higher: 17.3% across China as a whole (in yellow)
and greater than 20% in the center of the outbreak, in Wuhan (in blue).
But in the weeks that followed, the CFR declined, reaching as low as 0.7% for patients who first showed symptoms after
February 1st. The WHO reported that that was because “the standard of care has evolved over the course of the outbreak”.
You can also see that the CFR was different in different places. By 1st February, the CFR in Wuhan was still 5.8% while it was
0.7% across the rest of China.
This shows that what we said about the CFR generally – that it changes from time to time and place to place – is true for the
CFR of COVID-19 specifically. When we talk about the CFR of a disease, we need to talk about it in a specific time and place
– the CFR in Wuhan on 23rd February, or in Italy on 4th March – rather than as a single unchanging value.
There are two reasons why the case fatality rate does not reflect the risk of death
If the case fatality rate does not tell us the risk of death for someone infected with the disease, what does it tell us? And how
does the CFR compare with the actual mortality risk?
There are two reasons why we would expect the CFR not to represent the real risk. One of them would tend to make the CFR
an overestimate – the other would tend to make it an underestimate.
When there are people who have the disease but are not diagnosed, the CFR will overestimate the true risk of death. With
COVID-19, we think there are many undiagnosed people.
As we saw above, in our discussion on the difference between total and confirmed cases (here), we do not know the number
of total cases. Not everyone is tested for COVID-19, so the total number of cases is higher than the number of confirmed
cases.
Whenever there are cases of the disease that are not counted, the probability of dying from the disease is lower than the
reported case fatality rate. Remember our imaginary scenario with 10 deaths and 100 cases. The CFR in that example is 10%
– but if there actually 500 cases (and we’ve simply missed 400 of them due to lack of testing), then the real risk (the IFR) is just
2%.
Or to summarize in one sentence. If the number of total cases is higher than the number of confirmed cases, then the ratio
between deaths and total cases is smaller than the ratio between deaths and confirmed cases.12
Importantly, this means that the number of tests carried out affects the CFR – you can only confirm a case by testing a patient.
So when we compare the CFR between different countries, the differences do not only reflect rates of mortality, but also
differences in the scale of testing efforts.
A second consideration is especially important in the early stages of an outbreak: When some people are currently
sick and will die of the disease, but have not died yet, the CFR will underestimate the true risk of death.
In ongoing outbreaks, people who are currently sick will eventually die from the disease. This means that they are currently
counted as a case, but will only eventually be counted as a death too. With the COVID-19 outbreak, it can take several weeks
for people to go from first symptoms to death.
This means that the CFR in the early stages is an underestimate of what it will be when the outbreak has run its course.
Case fatality rate of other diseases
Once again, we should stress what we discussed above. One has to understand the measurement challenges and the
definitions to interpret estimates of the CFR for COVID-19, particularly those relating to an ongoing outbreak.
As comparisons, the table shows the case fatality rates for other disease outbreaks. The CFR of SARS-CoV and MERS-CoV
were high: 10% and 34%, respectively.
The US seasonal flu has a case fatality rate of approximately 0.1% to 0.2%.
Acknowledgements
We would like to acknowledge and thank a number of people in the development of this work: Carl Bergstrom, Bernadeta
Dadonaite, Natalie Dean, Joel Hellewell, Jason Hendry, Adam Kucharski, Moritz Kraemer and Eric Topol for their very helpful
and detailed comments and suggestions on earlier versions of this work. Tom Chivers we would like to thank for his editorial
review and feedback.
And we would like to thank the many hundreds of readers who give us feedback on this work every day. Your feedback is what
allows us to continuously clarify and improve it. We very much appreciate you taking the time to write. We cannot respond to
every message we receive, but we do read all feedback and aim to take the many helpful ideas into account. Thank you all.
Citation
Our articles and data visualizations rely on work from many different people and organizations. When citing this entry, please
also cite the underlying data sources. This entry can be cited as:
Hannah Ritchie, Edouard Mathieu, Lucas Rodés-Guirao, Cameron Appel, Charlie Giattino, Esteban Ortiz-Ospina, Joe Hasell,
Bobbie Macdonald, Diana Beltekian and Max Roser (2020) - "Coronavirus Pandemic (COVID-19)". Published online at
OurWorldInData.org. Retrieved from: 'https://ourworldindata.org/coronavirus' [Online Resource]
BibTeX citation
@article{owidcoronavirus,
author = {Hannah Ritchie, Edouard Mathieu, Lucas Rodés-Guirao, Cameron Appel, Charlie Giattino, Esteban Ortiz-Ospina,
Joe Hasell, Bobbie Macdonald, Diana Beltekian and Max Roser},
title = {Coronavirus Pandemic (COVID-19)},
journal = {Our World in Data},
year = {2020},
note = {https://ourworldindata.org/coronavirus
Endnotes
For examples see Worldometers. Worldometers lists many poor examples of ‘mortality rates’ for COVID-19 without discussion here.
Taubenberger, J. K., & Morens, D. M. (2006). 1918 Influenza: the mother of all pandemics. Revista Biomedica, 17(1), 69-79.
We would therefore calculate the infection fatality rate as:
Infection fatality risk (IFR, in %) = [Number of deaths from disease / total number of cases of disease] x 100
Wong, J. Y., Heath Kelly, D. K., Wu, J. T., Leung, G. M., & Cowling, B. J. (2013). Case fatality risk of influenza A (H1N1pdm09): a systematic review. Epidemiology,
24(6).
Lipsitch, M., Donnelly, C. A., Fraser, C., Blake, I. M., Cori, A., Dorigatti, I., … & Van Kerkhove, M. D. (2015). Potential biases in estimating absolute and relative
case-fatality risks during outbreaks. PLoS Neglected Tropical Diseases, 9(7).
Kobayashi, T., Jung, S. M., Linton, N. M., Kinoshita, R., Hayashi, K., Miyama, T., … & Suzuki, A. (2020). Communicating the Risk of Death from Novel Coronavirus
Disease (COVID-19). Journal of Clinical Medicine.
Nishiura, H. (2010). Case fatality ratio of pandemic influenza. The Lancet Infectious Diseases, 10(7), 443.
Read JM, Bridgen JR, Cummings DA, Ho A, Jewell CP. Novel coronavirus 2019-nCoV: early estimation of epidemiological parameters and epidemic predictions.
medRxiv. 2020;2020.01.23.20018549.
World Health Organization (2020). Report of the WHO-China Joint Mission on Coronavirus Disease 2019 (COVID-19). Available online at:
https://www.who.int/docs/default-source/coronaviruse/who-china-joint-mission-on-covid-19-final-report.pdf
World Health Organization (2020). Report of the WHO-China Joint Mission on Coronavirus Disease 2019 (COVID-19). Available online at:
https://www.who.int/docs/default-source/coronaviruse/who-china-joint-mission-on-covid-19-final-report.pdf.
World Health Organization (2020). Report of the WHO-China Joint Mission on Coronavirus Disease 2019 (COVID-19). Available online at:
https://www.who.int/docs/default-source/coronaviruse/who-china-joint-mission-on-covid-19-final-report.pdf.
The relationship between CFR and IFR also depends on how large of a discrepancy there is between the number of confirmed and actual deaths, but we’d expect
the magnitude of undercounting of deaths to be less than for cases.
Munster, V. J., Koopmans, M., van Doremalen, N., van Riel, D., & de Wit, E. (2020). A novel coronavirus emerging in China—key questions for impact
assessment. New England Journal of Medicine, 382(8), 692-694.
The US flu data is sourced from the US CDC. Here we present an upper and lower estimate for the 2018-19 flu season. These two figures reflect whether we look
at the percentage of deaths out of the number of symptomatic illnesses (giving us 0.1%), or the number of medical visits (giving us 0.2%). In the traditional
calculation of CFR, we would tend to focus on the number of symptomatic illnesses. This is analogous to the number of confirmed cases, on which the COVID-19
figures are based. However, the US CDC derives these figures based on disease outbreak modelling which attempts to account for underreporting – you can read
more about how it derives its annual flu figures here.
This means that some of the biases which tend to underestimate the actual number of cases have been corrected for. This is not the case for the COVID-19
figures, so it may be an unfair comparison.
Looking at estimates based on the number of medical visits may discount from the US seasonal flu data many of the kind of mild cases that may have been
missed in the COVID-19 confirmed cases. However, this is likely to skew the comparison slightly in the other direction: we know that not all of the confirmed cases
included in COVID-19 figures were of a severity such that they would have received a medical visit in the absence of the heightened surveillance of the outbreak.
So, here we present both figures of the US seasonal flu figures: the CFR based on symptomatic illnesses, and those based on medical visits. It’s likely that the
fairest comparison to COVID-19 lies somewhere between these two values.
You can find the data for the reported cases, medical visits and deaths from the US Centers for Disease Control and Prevention (CDC) here. The CDC reports
35,520,883 symptomatic cases of influenza in the US and 34,157 deaths from the flu. To calculate the CFR based on symptomatic illnesses, we divide the number
of deaths by the number of confirmed cases and find a case fatality rate of 0.1%.{ref}(0.1%=[34,157 / 35,520,883] * 100)


OETC Home
Split Screen Instruction
Course Store - eCourses - FAQ - Login
Browser Troubleshooting - Contact us - Newsletter - Invoice Set-up
Terms & Conditions - Privacy Policy - Certificate Verification - Cheater Report
Operator Resources
© Copyright OETC Inc. 2005-2025 - All Rights Reserved